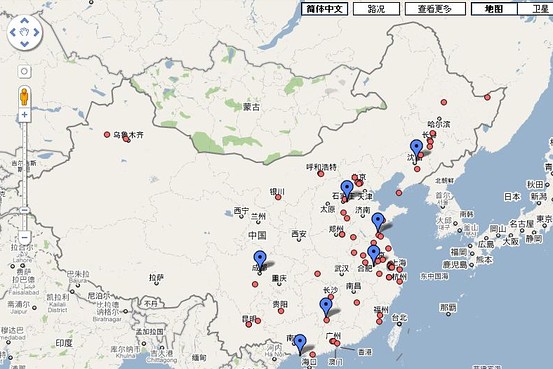
An interactive, participatory map project aims to show each and every violent land grab incident in China. The Wall Street Journal blog reports:
Called “the Blood-Stained Housing Map,” the project uses Google Maps to plot violent housing evictions and land grabs across the country. The result bears an eerie, and sobering, resemblance to the Guardian’s own Google Maps chart showing deaths recorded in the Wikileaks Iraq war logs.
The project actually consists of two maps: a “revised” version edited by the founder that shows only verified cases (above), and an “open” version [] that anyone can add to or edit.
A graphic Wikipedia of land-grab thuggery, the open version, which launched Oct. 8, has so far attracted more than 340,000 views and just over 90 contributions (below). Users have used a variety of icons to delineate different types of property-related violence: Volcanoes for mass protests, beds for when property owners were killed, and flames for when those resisting eviction lit themselves on fire. (Other icons appear to have been randomly selected.)
The project consists of an “open version” which anyone can edit, and a “revised version” (above) which has been checked by the editor for accuracy.
Read more about land disputes and forced evictions via CDT.


